The Problem: A Black Box AI Pipeline
GitIntel is an AI-powered GitHub repository analyzer that uses Gemini 2.5 Flash to evaluate repos across eight engineering dimensions. The workflow involves GitHub API calls, async file fetching, prompt construction, multiple Gemini API calls, response aggregation, and report generation. From the user's perspective, it's one click. From the app's perspective, it's a distributed pipeline.
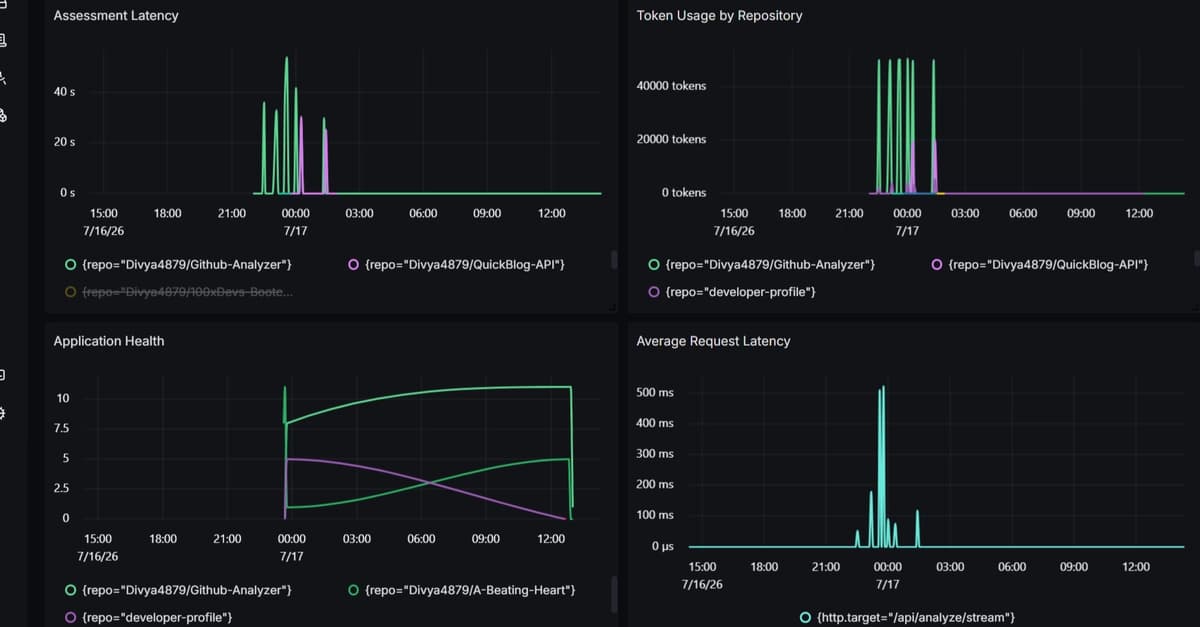
End-to-end latency ranged from 8 to 52 seconds. Token usage varied from 4,000 to 40,000 per repository. Application logs showed total token usage and overall duration, but couldn't answer: Which step took longest? Which Gemini batch caused the spike? How did GitHub API time compare with Gemini processing time? The app needed observability.
The Solution: OpenTelemetry + Self-Hosted SigNoz
The author instrumented GitIntel with OpenTelemetry and connected it to a self-hosted SigNoz instance. SigNoz is open-source, OpenTelemetry-native, and can be spun up locally with Docker Compose in under a minute.
Setup: Prerequisites
- Ubuntu 24.04, Python 3.12, Docker & Docker Compose v2
- GitHub Personal Access Token (classic, with
repoandread:userscopes) - Gemini API Key (free tier sufficient for
gemini-2.5-flash)
Part 1: Fork and Run
git clone https://github.com/YOUR_USERNAME/Github-Analyzer
cd Github-Analyzer
python3 -m venv venv
source venv/bin/activate
pip install -r requirements.txt
cp .env.example .env
# Edit .env with your tokens and OTEL_EXPORTER_OTLP_ENDPOINT=http://localhost:4317
uvicorn main:app --reload
The app runs at http://localhost:8000. But without SigNoz, you're blind to internal pipeline behavior.
Part 2: Self-Hosting SigNoz
The repo includes a Docker Compose stack under pours/deployment/compose.yaml. It launches:
- SigNoz UI & API on port 8080
- OpenTelemetry Collector on ports 4317 (gRPC) and 4318 (HTTP)
- ClickHouse for storage
- ClickHouse Keeper and Postgres for metadata
cd pours/deployment
docker compose up -d
# Wait ~60 seconds for ClickHouse initialization
Open http://localhost:8080. The dashboard is empty until GitIntel exports telemetry.
Part 3: How the Instrumentation Works
Telemetry setup is centralized in telemetry.py:
OTLP_ENDPOINT = os.getenv("OTEL_EXPORTER_OTLP_ENDPOINT", "http://localhost:4317")
SERVICE_NAME  = os.getenv("OTEL_SERVICE_NAME", "gitintel")
resource = Resource.create({"service.name": SERVICE_NAME})

def setup_telemetry(app):
    otlp_available = OTLP_ENDPOINT != "http://localhost:4317" or os.getenv("OTEL_ENABLED")
    tracer_provider = TracerProvider(resource=resource)
    if otlp_available:
        tracer_provider.add_span_processor(
            BatchSpanProcessor(
                OTLPSpanExporter(endpoint=OTLP_ENDPOINT, insecure=True)
            )
        )
    trace.set_tracer_provider(tracer_provider)
    FastAPIInstrumentor.instrument_app(app)
    RequestsInstrumentor().instrument()
Key details:
BatchSpanProcessorbatches spans before export, reducing overhead during analysis.FastAPIInstrumentorandRequestsInstrumentorauto-instrument the FastAPI app and HTTP requests with zero manual spans.- The
otlp_availableguard prevents connection errors when no collector is running (e.g., in production on Render). Without it, the app would flood logs withconnection refusederrors every few seconds.
Insights Uncovered
Once SigNoz was running, the author could see:
- Per-step timing: which API call consumed 30 of the 40 seconds.
- Token usage per repo:
gemini.tokens.total,gemini.tokens.prompt,gemini.tokens.completion. - GitHub API time vs. Gemini processing time.
- Which repository drove token usage.
The observability stack turned guesswork into targeted optimization.
How to Reproduce
- Fork the repo:
https://github.com/YOUR_USERNAME/Github-Analyzer - Set up Python environment and install dependencies.
- Create
.envwith your tokens and OTLP endpoint. - Start SigNoz stack with
docker compose up -d. - Run
uvicorn main:app --reload. - Analyze any GitHub repo and watch telemetry appear in SigNoz under Services → gitintel.
Why This Matters
Observability isn't optional for AI pipelines. When one analysis uses 40,000 tokens and another uses 4,000, and latency varies 6x, you need distributed tracing to understand why. OpenTelemetry + SigNoz provides that visibility with minimal code changes.