Real V-I Curves: Why Textbook Diagrams Lie
Most electronics textbooks and online tutorials show idealized V-I plots for diodes and transistors. They're often retraced from ancient texts or sketched from memory. lcamtuf, author of The Secret Life of Circuits, decided to capture real data for his book's 290 original illustrations. The challenge: semiconductor characteristics change with temperature, and currents can range from microamps to amps in the same device.
The Setup: Ditch the Oscilloscope, Use a DMM and Pulsed Power
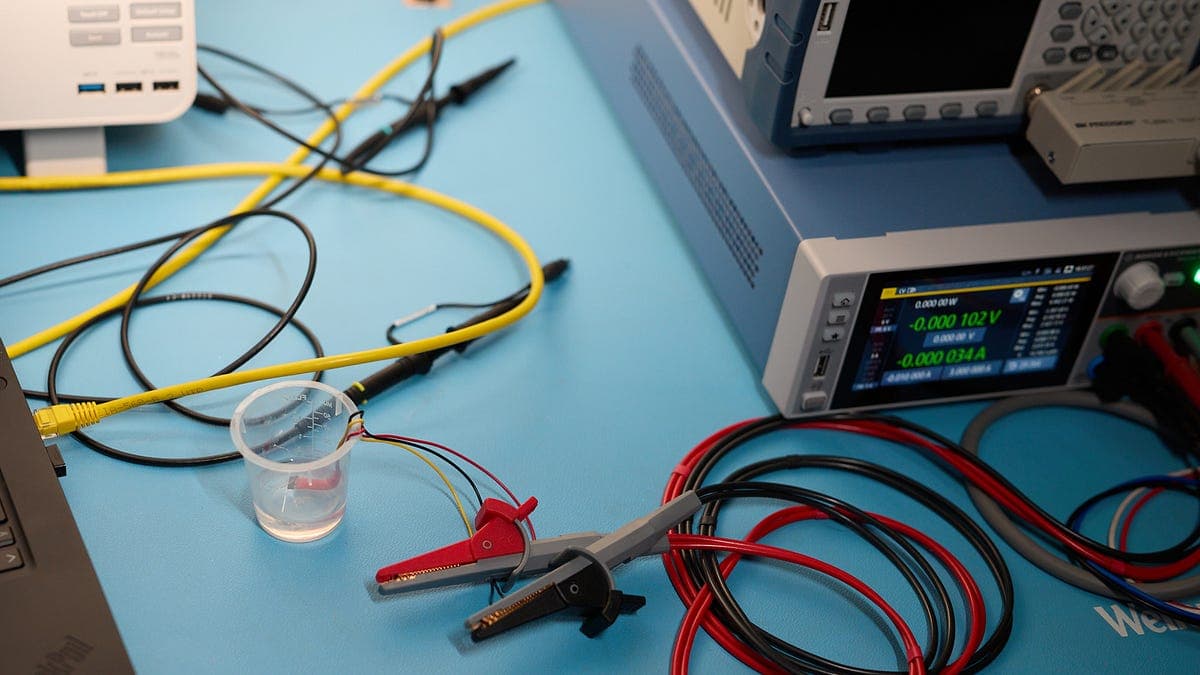
Oscilloscopes struggle with microamp currents and thermal drift. lcamtuf switched to a benchtop multimeter (DMM) for low-current precision and a lab supply with pulsed power to minimize self-heating. He also submerged devices in mineral oil for cooling.
To automate measurements, he used SCPI (Standard Commands for Programmable Instruments). Many benchtop instruments support SCPI over RS-232, USB, or Ethernet. Example query: *IDN?\n returns device identity. MEAS:VOLT? reads voltage. Commands like SOUR:VOLT 1.2 set voltage, and OUTP 1 turns on the output.
Enter the Source Measure Unit (SMU)
His basic power supply lacked remote control, so he bought a Rohde & Schwarz NGU401 SMU on eBay for a fraction of its $9,000 MSRP. An SMU combines a power supply and multimeter with fast response. The NGU401 supports FastLog, sampling up to 500k samples/second, sending binary 4-byte floats.
Gotcha: The serial-over-USB interface corrupts binary data. Ethernet works reliably.
Capturing a Diode Curve
His C code (available here) uses FastLog at 10 ksps. For currents below 0.3 mA, it leaves the supply on and averages 2,500 points. For higher currents, it pulses power for 5 ms and averages the best 20 samples.
Results for a 1N4148 diode (rated 300 mA continuous):
- Forward bias from microamps to nearly 2 A (4 A possible but no extra detail).
- The log-current plot shows deviation from exponential behavior around 10 mA due to resistive effects in the semiconductor substrate.
Zener and MOSFET Curves
For a 1N4731 Zener (4.3 V, 58 mA), the reverse breakdown is less steep than forward bias. The same toolkit works for transistors. For a BS170 MOSFET, he plotted drain-source voltage vs. current at various gate-source voltages. The transistor acts as a constant-current device in its usual range (VDS 1–10 V).
Breakdown region: The spec says 60 V, but real breakdown is gradual. At VGS = 0 V, it's diode-like. At practical VGS, the transistor starts conducting well before 60 V.
High-Voltage Hack: Series Supply + Pulsed Gate
His SMU maxes at 20 V. To reach 60 V, he added a floating power supply in series and stitched captures across multiple voltage spans. To avoid overheating the MOSFET at high VDS, he pulsed the gate signal (5 ms pulses at low duty cycle) from a signal generator. The code averages current over 2.5 seconds per set point.
Key Takeaways
- Real V-I curves reveal non-ideal behavior (resistive effects, gradual breakdown) that textbook diagrams hide.
- SMUs are expensive new but cheap used; SCPI automation is essential for precise, repeatable measurements.
- Pulsed power and cooling (mineral oil) mitigate thermal drift.
- For high voltages, series-stacking supplies and pulsing the control signal works.
Why It Matters for Developers
If you build hardware or simulate circuits, real data improves accuracy. lcamtuf's approach (SCPI, SMU, pulsed measurements) is reproducible with common lab gear. The code is open-source and adaptable to other devices.
Editor's Take
I've spent hours fighting thermal drift with a benchtop multimeter and a manual power supply. lcamtuf's pulsed method is elegant. I'm now hunting for a used SMU on eBay—the NGU401 looks perfect. The Ethernet corruption bug is a pain, but his fix (use Ethernet, not USB) saved me debugging time. I wish more electronics content showed real measurements instead of idealized curves.