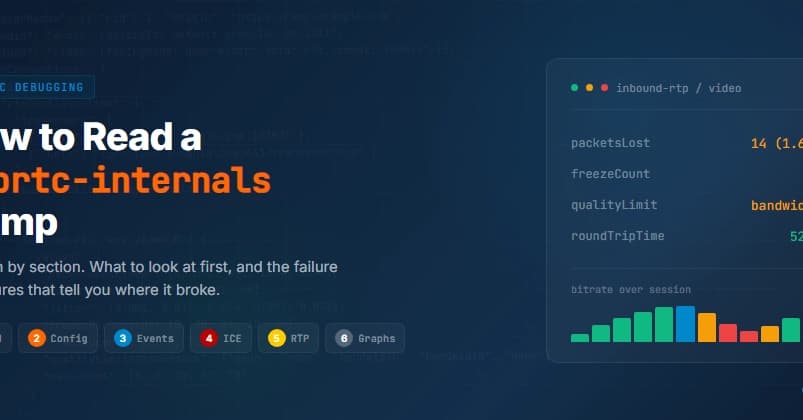
The Problem with webrtc-internals Dumps
When a WebRTC call goes bad, Chrome already recorded everything at chrome://webrtc-internals. You can export a JSON dump, but it's dense, undocumented, and easy to misread. This field guide walks through each section, what to look at first, and the failure signatures that tell you where the call broke.
The Shape of a Dump
A dump has two top-level parts:
- getUserMedia calls: Every microphone and camera request with constraints and resolved tracks.
- RTCPeerConnection blocks: Each has connection config (ICE servers), an event log (signaling and ICE state changes), and stats graphs (every
getStats()metric sampled over the call).
Read them in that order. Most people jump straight to the graphs and miss that the call never negotiated.
1. The getUserMedia Section: Did You Get the Media You Asked For?
Each entry shows requested constraints and the resolved track. Two quick checks:
- Asked for video, got audio only? A constraint failed or permission denied. The rest of the call will look "broken" but the root cause is here.
- Resolution or frame rate lower than requested? The device could not satisfy the constraint and the browser silently downgraded. Worth knowing before you blame the network.
Also note the device brand (microphone and webcam)—it sometimes sheds light on your problem.
2. The Connection Config: Is There a TURN Server?
In the peer connection block, look at the iceServers config. If there is no turn: entry, the call can only connect when both sides have a direct path. On real networks (corporate firewalls, symmetric NAT, mobile), that fails a meaningful fraction of the time. A missing or misconfigured TURN server is one of the most common production failures, and it's invisible unless you look here.
3. The Event Log: How Far Did Negotiation Get?
The event log is the timeline. Read it top to bottom and watch two state machines:
- Signaling:
setLocalDescriptionandsetRemoteDescriptionfiring in order, ending instable. If you never reachstable, the offer/answer exchange broke (often an SDP or m-line mismatch). No media will flow. - ICE connection state: The sequence you want is
new→checking→connected→completed. Failure signatures:- Stuck in
checking, thenfailed: connectivity. The two sides could not find a working path. Go to candidate pairs. connectedthendisconnectedthen back: an unstable network mid-call, not a setup problem.completedcleanly: negotiation is fine. Your problem is media quality. Skip to section 5, but first check the active candidate pair.
- Stuck in
4. The Selected Candidate Pair: How Did the Call Connect (or Not)?
Filter the stats for candidate-pair and find the nominated/selected pair. The local and remote candidate types tell a story:
hosttohost: direct local network. Best case.srflx(server-reflexive): connected through NAT via STUN. Normal.relay: the call is going through your TURN server. It works, but costs bandwidth and adds latency. If most calls are relay, that's a finding.- No selected pair: ICE failed. Cross-reference the config: if there were no relay candidates and the network needed one, that's your answer.
On the selected pair, currentRoundTripTime is your real network latency. Anything consistently above ~300ms will be felt as lag.
5. The RTP Stats: Where the Quality Actually Lives
This is the part most people mean when they say "read the dump." Look at inbound-rtp (media you received) and outbound-rtp (media you sent), per track. The metrics that matter:
- packetsLost / packet loss rate: Rising loss on inbound means the network dropped data on the way to you. A few percent is survivable; sustained double digits is not.
- jitter: Variation in packet arrival timing. High jitter forces the jitter buffer to grow, causing delay or robotic audio.
- framesPerSecond, frameWidth/frameHeight: If these drop mid-call, the video encoder is shedding quality. The next metric tells you what.
- qualityLimitationReason (on outbound video): The single most useful field.
bandwidthmeans the network could not carry the bitrate.cpumeans the machine could not encode fast enough.nonemeans the encoder was unconstrained. - freezeCount / totalFreezesDuration (inbound video): Directly counts visible freezes. If this climbs, the user saw the call stutter.
- nackCount, pliCount, firCount: Retransmission and keyframe requests. Spikes track loss and decode trouble.
- Audio:
concealmentEvents,insertedSamplesForDeceleration—the audio equivalent of freezes. Rising concealment means the network is hiding gaps, heard as choppy audio.
6. The Graphs: Read the Shape Over Time
Every metric above is plotted over the call. The shape is the diagnosis:
- Bitrate climbs then collapses, with
qualityLimitationReason: bandwidth: Congestion. The call ran out of network and BWE backed off. - Packet loss spikes at intervals while RTT stays flat: Bursty loss (Wi-Fi interference, saturated uplink), not pure congestion.
- Resolution stair-stepping down while CPU is pinned: An underpowered device, not the network.
- Everything flat and healthy but user still complained: Look back at sections 3 and 4. The call may have taken too long to connect, or connected over a slow relay.
Putting It Together
The method is always the same: confirm media exists (1-2), confirm negotiation and connection (3-4), then read RTP stats and graphs to separate network problems (loss, jitter, RTT) from media problems (qualityLimitationReason: cpu, resolution drops) from connectivity problems (ICE failed, all-relay). Most "bad call" tickets resolve to one of those three buckets.
If you'd rather not parse JSON by hand, rtcStats reads a webrtc-internals dump and surfaces the same findings automatically: flags the observations above, scores the call's experience, and explains in plain language. Upload the dump in the browser and get the read without the manual pass. Either way, now you know what the tool is looking at.
The open source piece of rtcStats enables you to systematically collect webrtc-internals-like dumps (called rtcstats files) in your WebRTC deployment, so every call is counted, logged, and analyzed.